In-App Analytics on TUTOR — "Bam, and it's given me everything I need"

on 15 July 2024

"This is my class, this is what I want to know, this is my timeframe, bam, and it's given me everything I need"

In-App Analytics lets teachers inspect pupil activity on TUTOR with ease.

Easy access to activity data supports more effective school-wide implementation, provides evidence of educational impact, and informs further targeted intervention.

In-App Analytics is available for all teacher users, in all school accounts, showing live data for all pupils.

Why we’ve built In-App Analytics

As implementation of TUTOR in schools has expanded and matured, we recognise the importance of being able to measure and track pupil activity in a reliable and flexible way.

We have been supporting activity monitoring through bespoke PowerBI boards for schools, however this comes with certain technical limitations (being a third-party app) and usability issues, particularly when used in the school environment.

So, to continue to enhance the TUTOR experience for our partner schools, and to empower all teacher users through full access to relevant, reliable, and live data, we have brought Analytics into the TUTOR app.

A big thank you to everyone involved in the process of building this new functionality, from initial feedback, to interviews, beta testing, and beyond. We really appreciate your input and hope that this release will provide real value to you and your team!

"I'm really excited to show other teachers, they're going to be really happy."

Blog Title

What’s included in In-App Analytics

Activity Data

With In-App Analytics comes the ability to monitor aspects of pupil activity and behaviour on TUTOR that have previously been unavailable to teachers. 

In doing so, you see where your pupils are spending their time on TUTOR, indicating where they are excelling and where they might be struggling, as well as showing how much effort pupils are putting into their TUTOR work.

Here is a breakdown of the activity data you can inspect via In-App Analytics:

  • Goal Completion
  • Get Ready step — Get Ready Quiz Score, Knowledge Gap Quizzes Taken
  • Learn step — Minutes watched, % video watched
  • Do step — Minutes watched, % video watched
  • Practice step — Questions answered, Top Gauge Level
  • Quiz step — Quizzes Taken, Average Score, Top Score
  • Remember step — Quizzes Taken, Average Score, Top Score

Analytics Tables

To begin with, Analytics data is provided in two key table views.

Goal Activity Table

The first is the Goal Activity table, detailing how pupils have been engaging with the various learning activities on TUTOR and, very importantly, on which specific Goals.

Immediately, this table shows the ‘level’ of maths that pupils have been accessing, in the context of the full Complete Mathematics Curriculum. Goal activity is summarised by Goal Groups — at a whole Curriculum level, at a Stage-by-Stage level, and at a Unit-by-Unit level — and is detailed at the granular Goal-by-Goal level. In this way, you can see the bigger picture, or dive deeper, as and when you need. 

If you have assigned Courses to your pupils — in-built TUTOR courses or your own Bespoke courses — then you can filter the view to show only the Goals within the selected Course, listed in the order of the Course. This supports school implementations using Bespoke Courses on TUTOR, for example to secure pre-requisite knowledge prior to upcoming classroom topics or following question-level assessment analysis.

Cohort Summary Table

The second table is the Cohort Summary table, for quick comparison of pupil activity totals.

The key difference from the Goal Activity table is that, by removing the Curriculum breakdown context, we can show the full array of activity for multiple pupils at the same time.

Cohort Summary Analytics table — summarising activity of the class 7Ma2 over the past academic year

Data Filtering

Both tables can be filtered to show activity data for the individual or group, curriculum elements, or date range you are interested in.

Filter by Tag or Individual

You can show data for a group of pupils defined by a particular Tag, e.g. classes, year groups, intervention groups. This makes weekly homework completion tracking a breeze.

Alternatively, you can focus on all activity data for a particular pupil — this version of the Goal Activity table will be a very useful view for parents’ evenings!

Filter by Curriculum or Courses

Show activity data for all goals across the whole curriculum, or filter to only show activity on goals of a particular course — Bespoke, Stage, Target, or Topic.

Filter by Date

Choose the date range you want to inspect pupil activity for. 

Use the default relative date ranges — today, last week, last month — or set your own date range using the calendar tool. In this way you can see activity over your own schools term dates, and adapt to your own homework setting schedules.

"This, to me, gives me exactly what I need to know..."

Other Analytics Table features

Goal Group Summaries

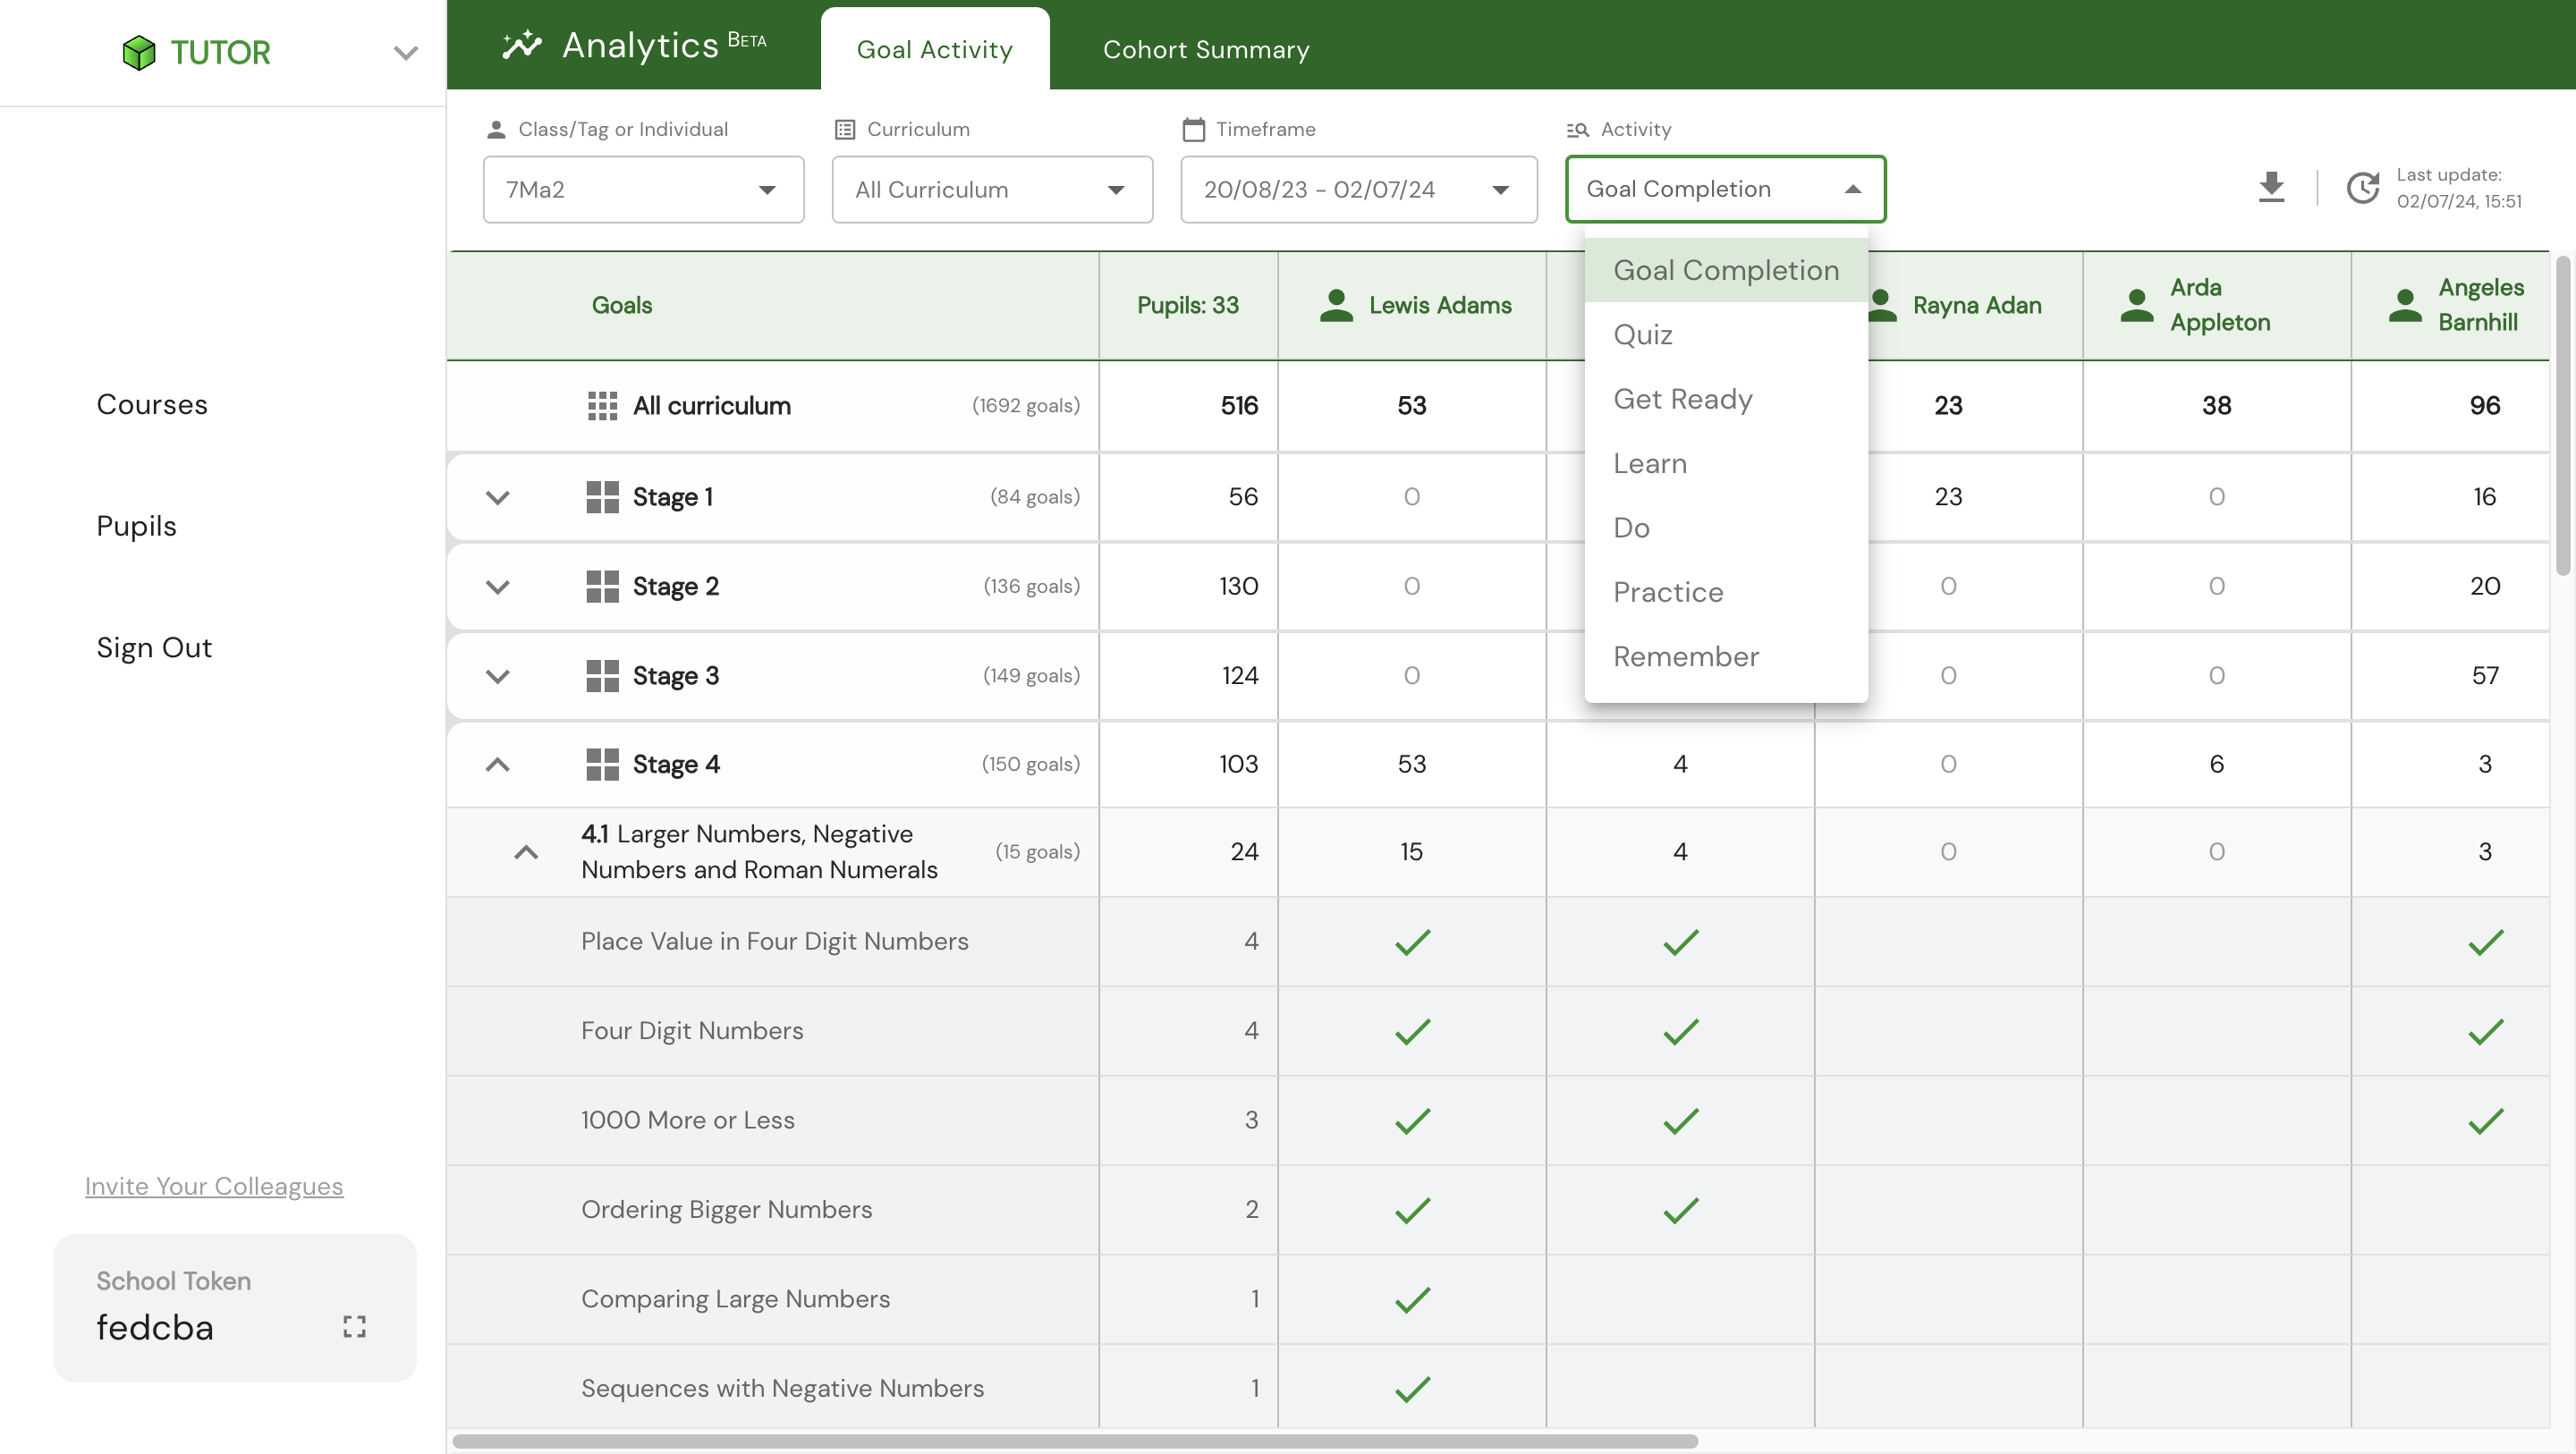
Where Goals are grouped by Unit, Stage, Course, or whole Curriculum, a summary of the activity is shown for all the included Goals in the group. For example, a single Goal will show as True (tick) or False (blank) for Goal Completion, whereas a Stage Goal Group will show the total number of completed Goals inside it. Goal Group summaries for the various activity data will differ, providing the most appropriate total or average for that activity.

Exporting

Any analytics table that you generate can be exported as a CSV file. We hope this provides you with the flexibility for reporting and further data exploration if you are looking for something specific.

Refreshing

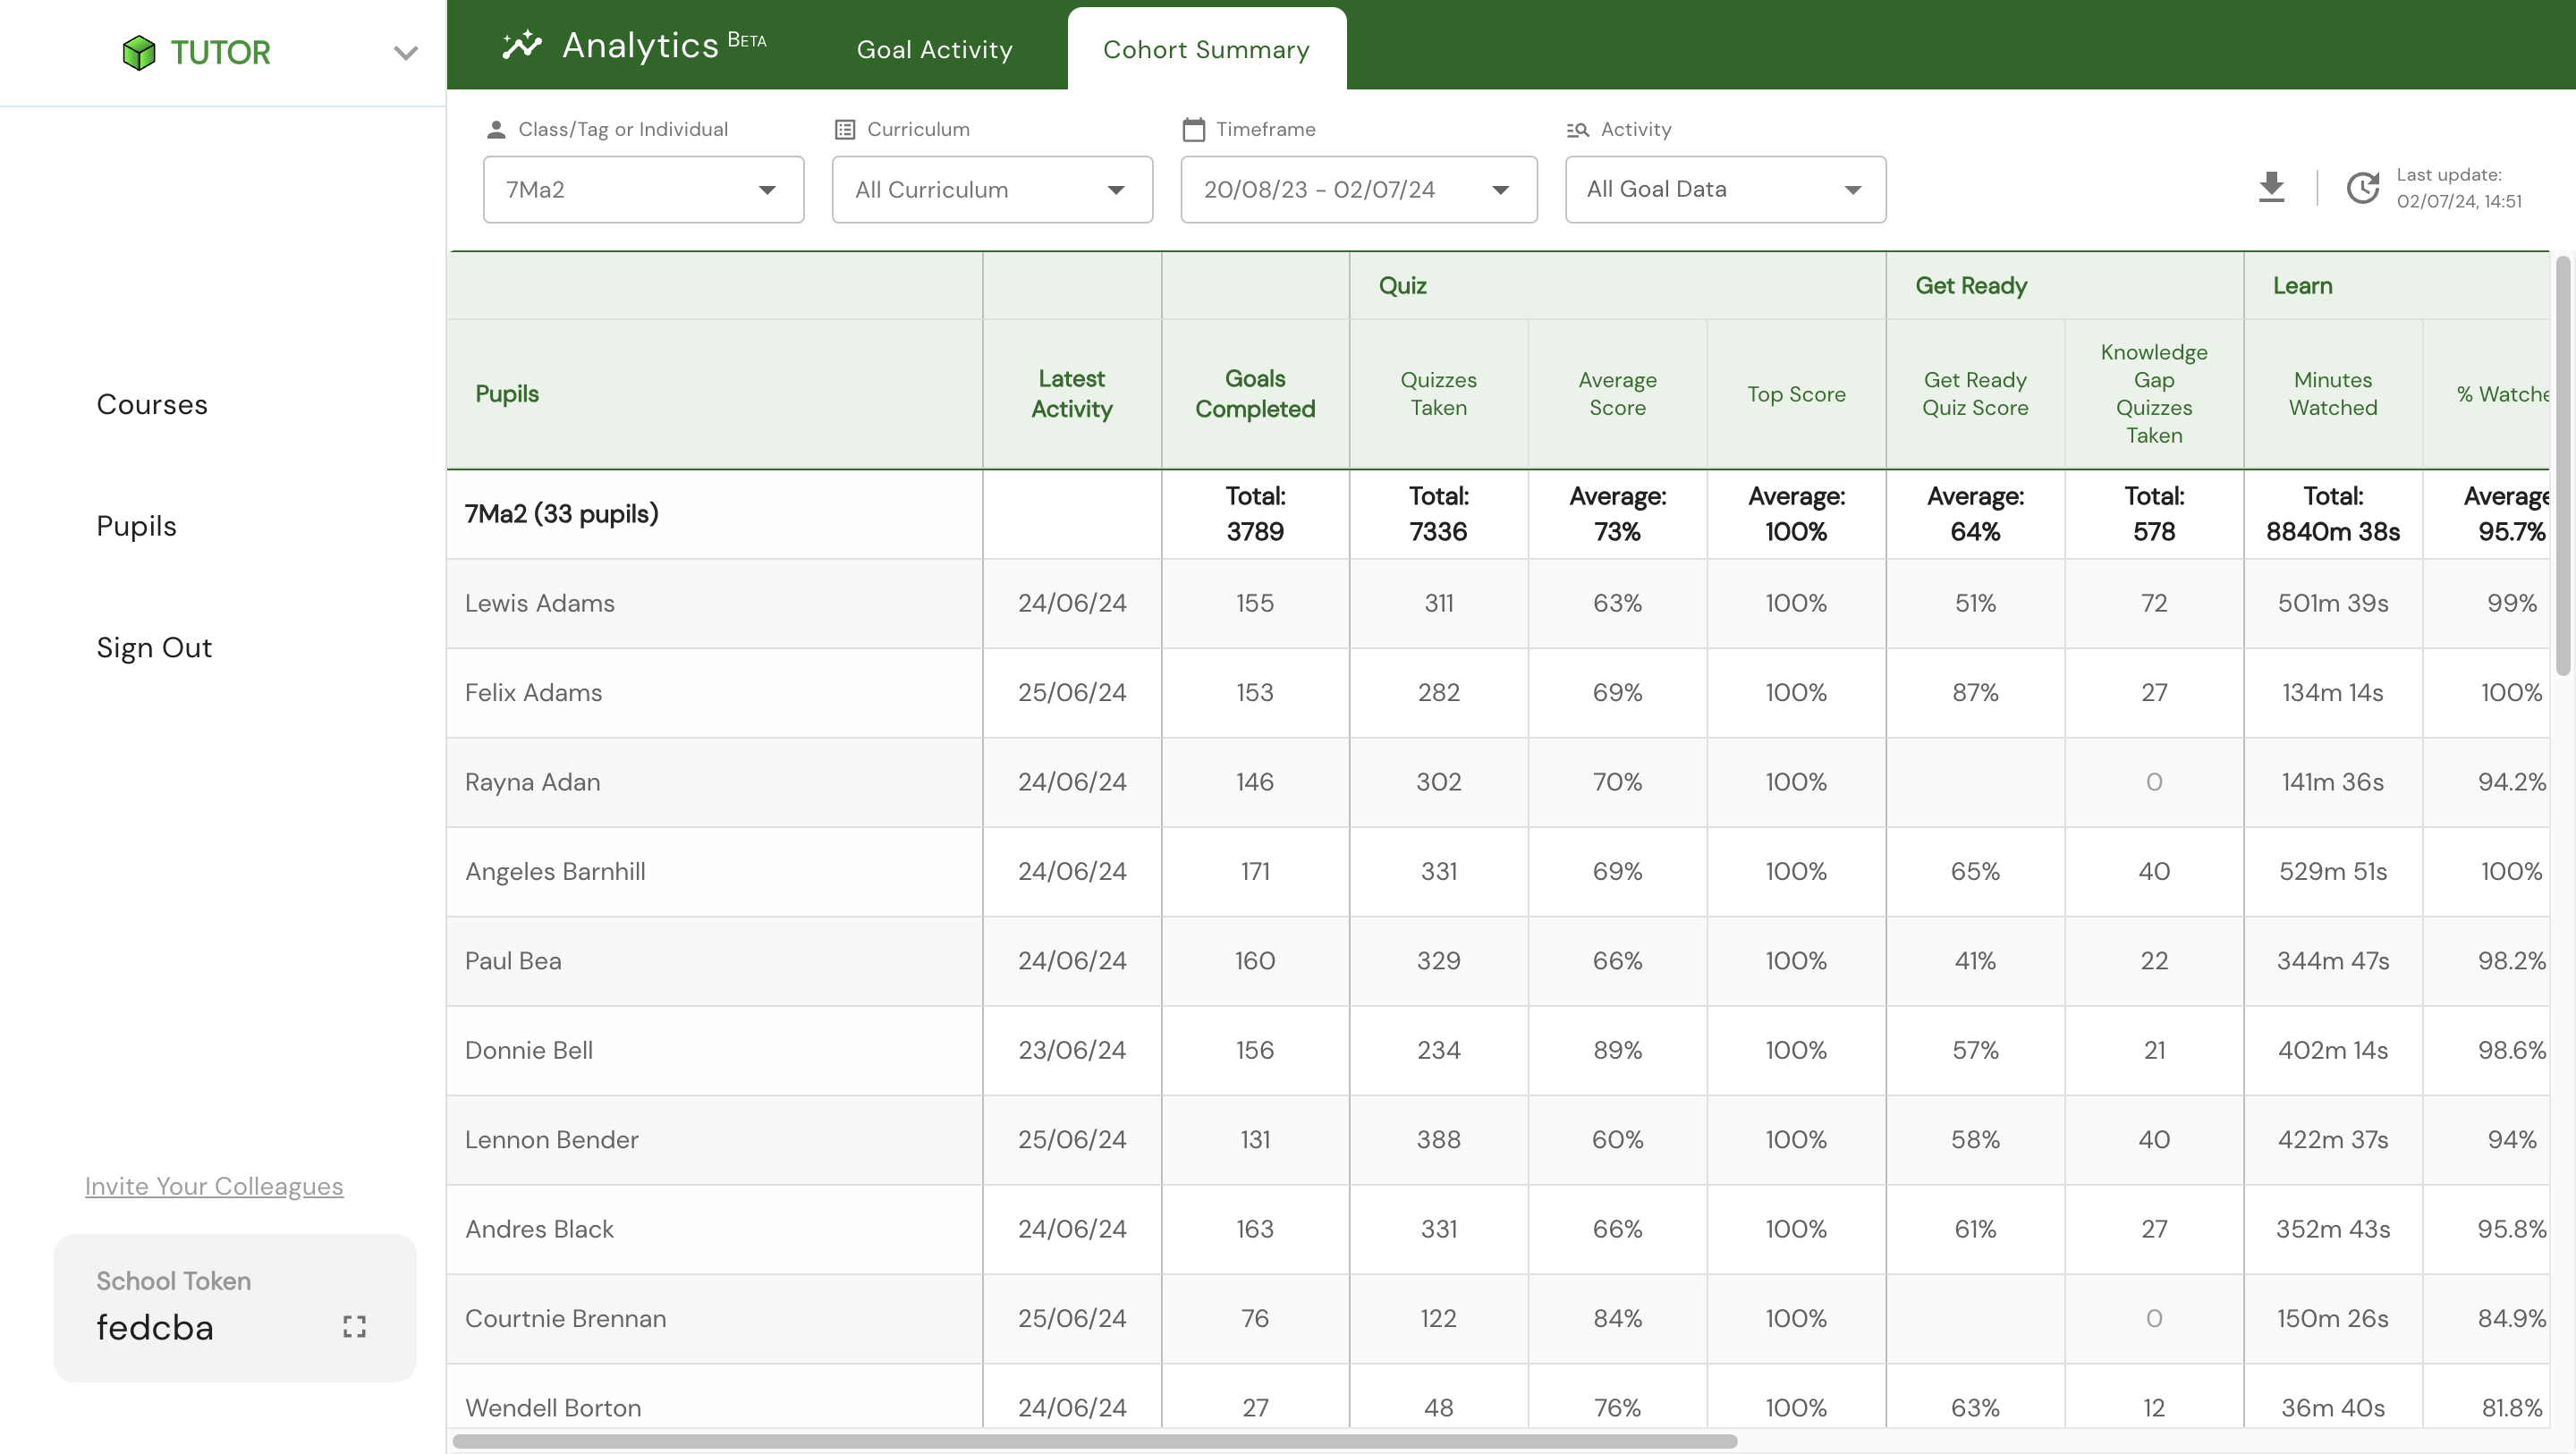
We know how important it is for you to be able to trust the activity data displayed, particularly when it is informing your decision making in the classroom. That’s why we have included an indication of when your data was last generated and the ability to refresh the table, to offer peace of mind that you are viewing the most up-to-date activity. 

Loading

Pulling in and calculating all of this data for Analytics is no small task for TUTOR. We have optimised loading speeds for both smaller and larger datasets, but if you’re loading up all time data for all pupils across your school (we’re looking at you, school with almost 1,000,000 completed goals!), you might see our loading state for a short time as it processes multitudes of data!

If a load fails and you find yourself on our fallback page, don't worry! You can retry with the same setup, or can change your filters to generate a different Analytics table.

Mobile Friendly

Even though data tables and small screens don't tend to go well together, we've made sure that you are able to create the Analytics tables you want on a tablet or mobile device, so that you can at least take a quick look, or perhaps export a report to email on to a colleague.

The Result?

In the words of one of our Analytics beta users:

"I could roll this out really really easily to staff, because actually when I looked at that, to me straight away it's really easy to see what you want to find. I think the staff in my school would go 'yes I can use this, I click on analytics, this is my class, this is what I want to know, this is my timeframe, bam and it's given me everything I need'"

Release Summary

  • Analytics within TUTOR — live data for all teachers in all schools, fully accessible in one place using the same Complete Maths login. 
  • Pupil by-Goal activity breakdown, detailing: Goal Completion, Get Ready, Learn, Do, Practice, Quiz, & Remember step data. Showing specific in-goal activity for each pupil.
  • Whole Curriculum or Course-specific breakdown, with Stage, Unit, TUTOR & Bespoke Course level summaries. Showing ‘What Maths’ pupils are working on.
  • Cohort Summary table: easily review and compare activity summaries for a group of pupils in a timeframe of your choosing.
  • Filter pupils by group (tag) or individually.
  • Filter date range, choosing custom dates or presets to filter activity data quickly.
  • Export & Refresh table functionality, for greater flexibility & control in implementation.
  • Progress Status visibility, for a trustworthy and user friendly Analytics experience.

Log in to Complete Maths TUTOR here to check out In-App Analytics for your pupils.

Don't have an account yet? Click here to set up an implementation meeting with our team to learn more!

FAQs

Is the Analytics activity data live and up to date?

Yes. In building a new Complete Maths database and bringing Analytics in-app, this means that the data you generate in your Analytics table is always up to date with the latest activity, rather than being updated once per day as per the PowerBI report.

If a pupil completes a goal from their Focus 5, will it show against the same goal in a bespoke course?

Yes, pupil activity will be shown against goals in a course regardless of whether the pupil accessed the goal directly via the particular course, or through their Focus 5 or a different course instead.

Will I still be able to access the PowerBI Analytics boards?

For the time-being, PowerBI TUTOR Analytics boards will remain active and updated each weekday.

We will however be phasing out the PowerBI Analytics boards after an initial introductory period for the new In-App Analytics. We will be working closely with Complete Mathematics users to ensure this transition is not disruptive.